The Helm.
Where the platform lives.
Road Triage is the Transportation Intelligence Platform. The Helm is the browser workspace where field-collected assessment data, federal and state DOT context, AI-assisted analysis, threaded discussions, and ready-to-deliver reports all live in one tab.
What Helm does. All in one place.
Road Triage is the Transportation Intelligence Platform — The Helm is where the platform's tools live in your browser. Each tile below is a module; tap any one to jump down to the deeper view.
Everything lives on the map.
Every Road Triage assessment is a named layer. Public-record federal and state DOT datasets — crashes, bridges, flood zones, climate, equity, and more — are layers on the same map. Toggle them individually, filter by severity or score, or stack them together. Color coding is consistent across every view — green, yellow, red — so the story of the network reads at a glance.
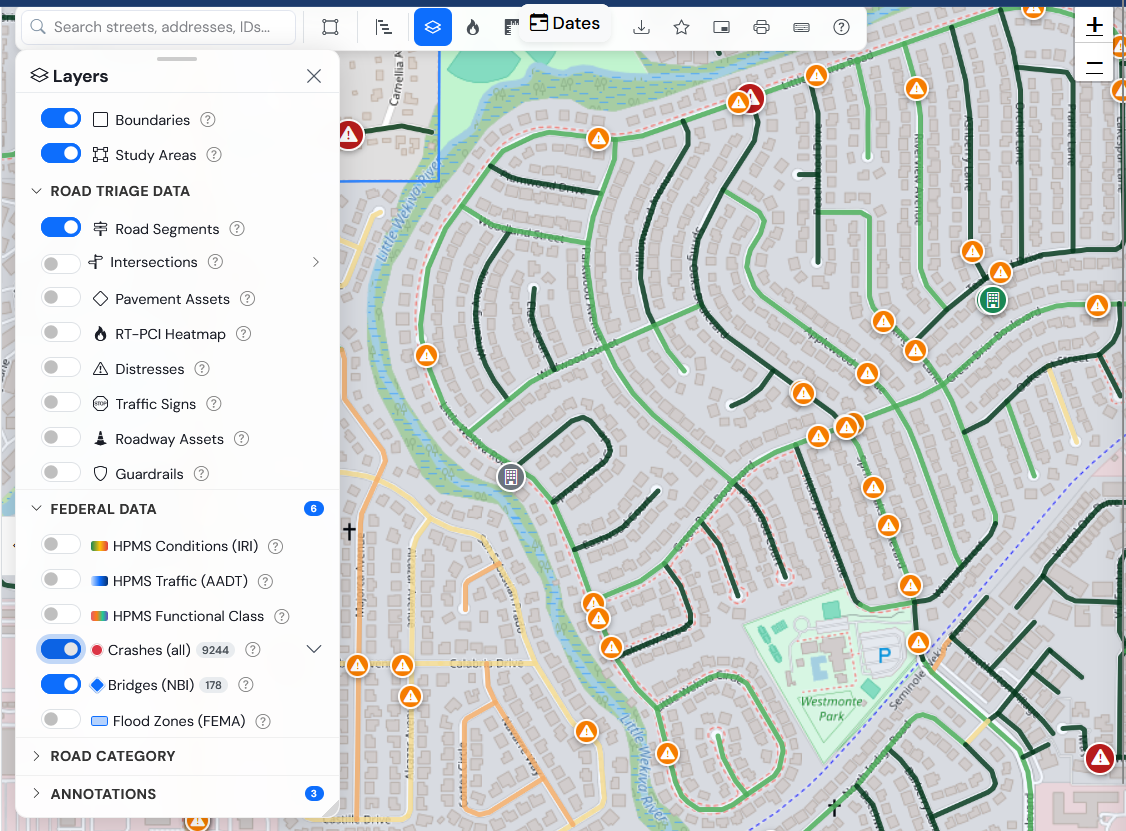
Layer the data. Read the story.
Road Triage layers and federal/state overlays live in the same Layers panel. The map is the index; the layers are the chapters — turn on what you need, filter by severity or score, and stack them in combination.
A corridor with declining pavement, fading markings, and clustered crashes reads differently than a corridor with declining pavement alone. Helm shows you which is which — the urgency call stays with your engineers.
Federal & state overlays included
Click any section. See everything.
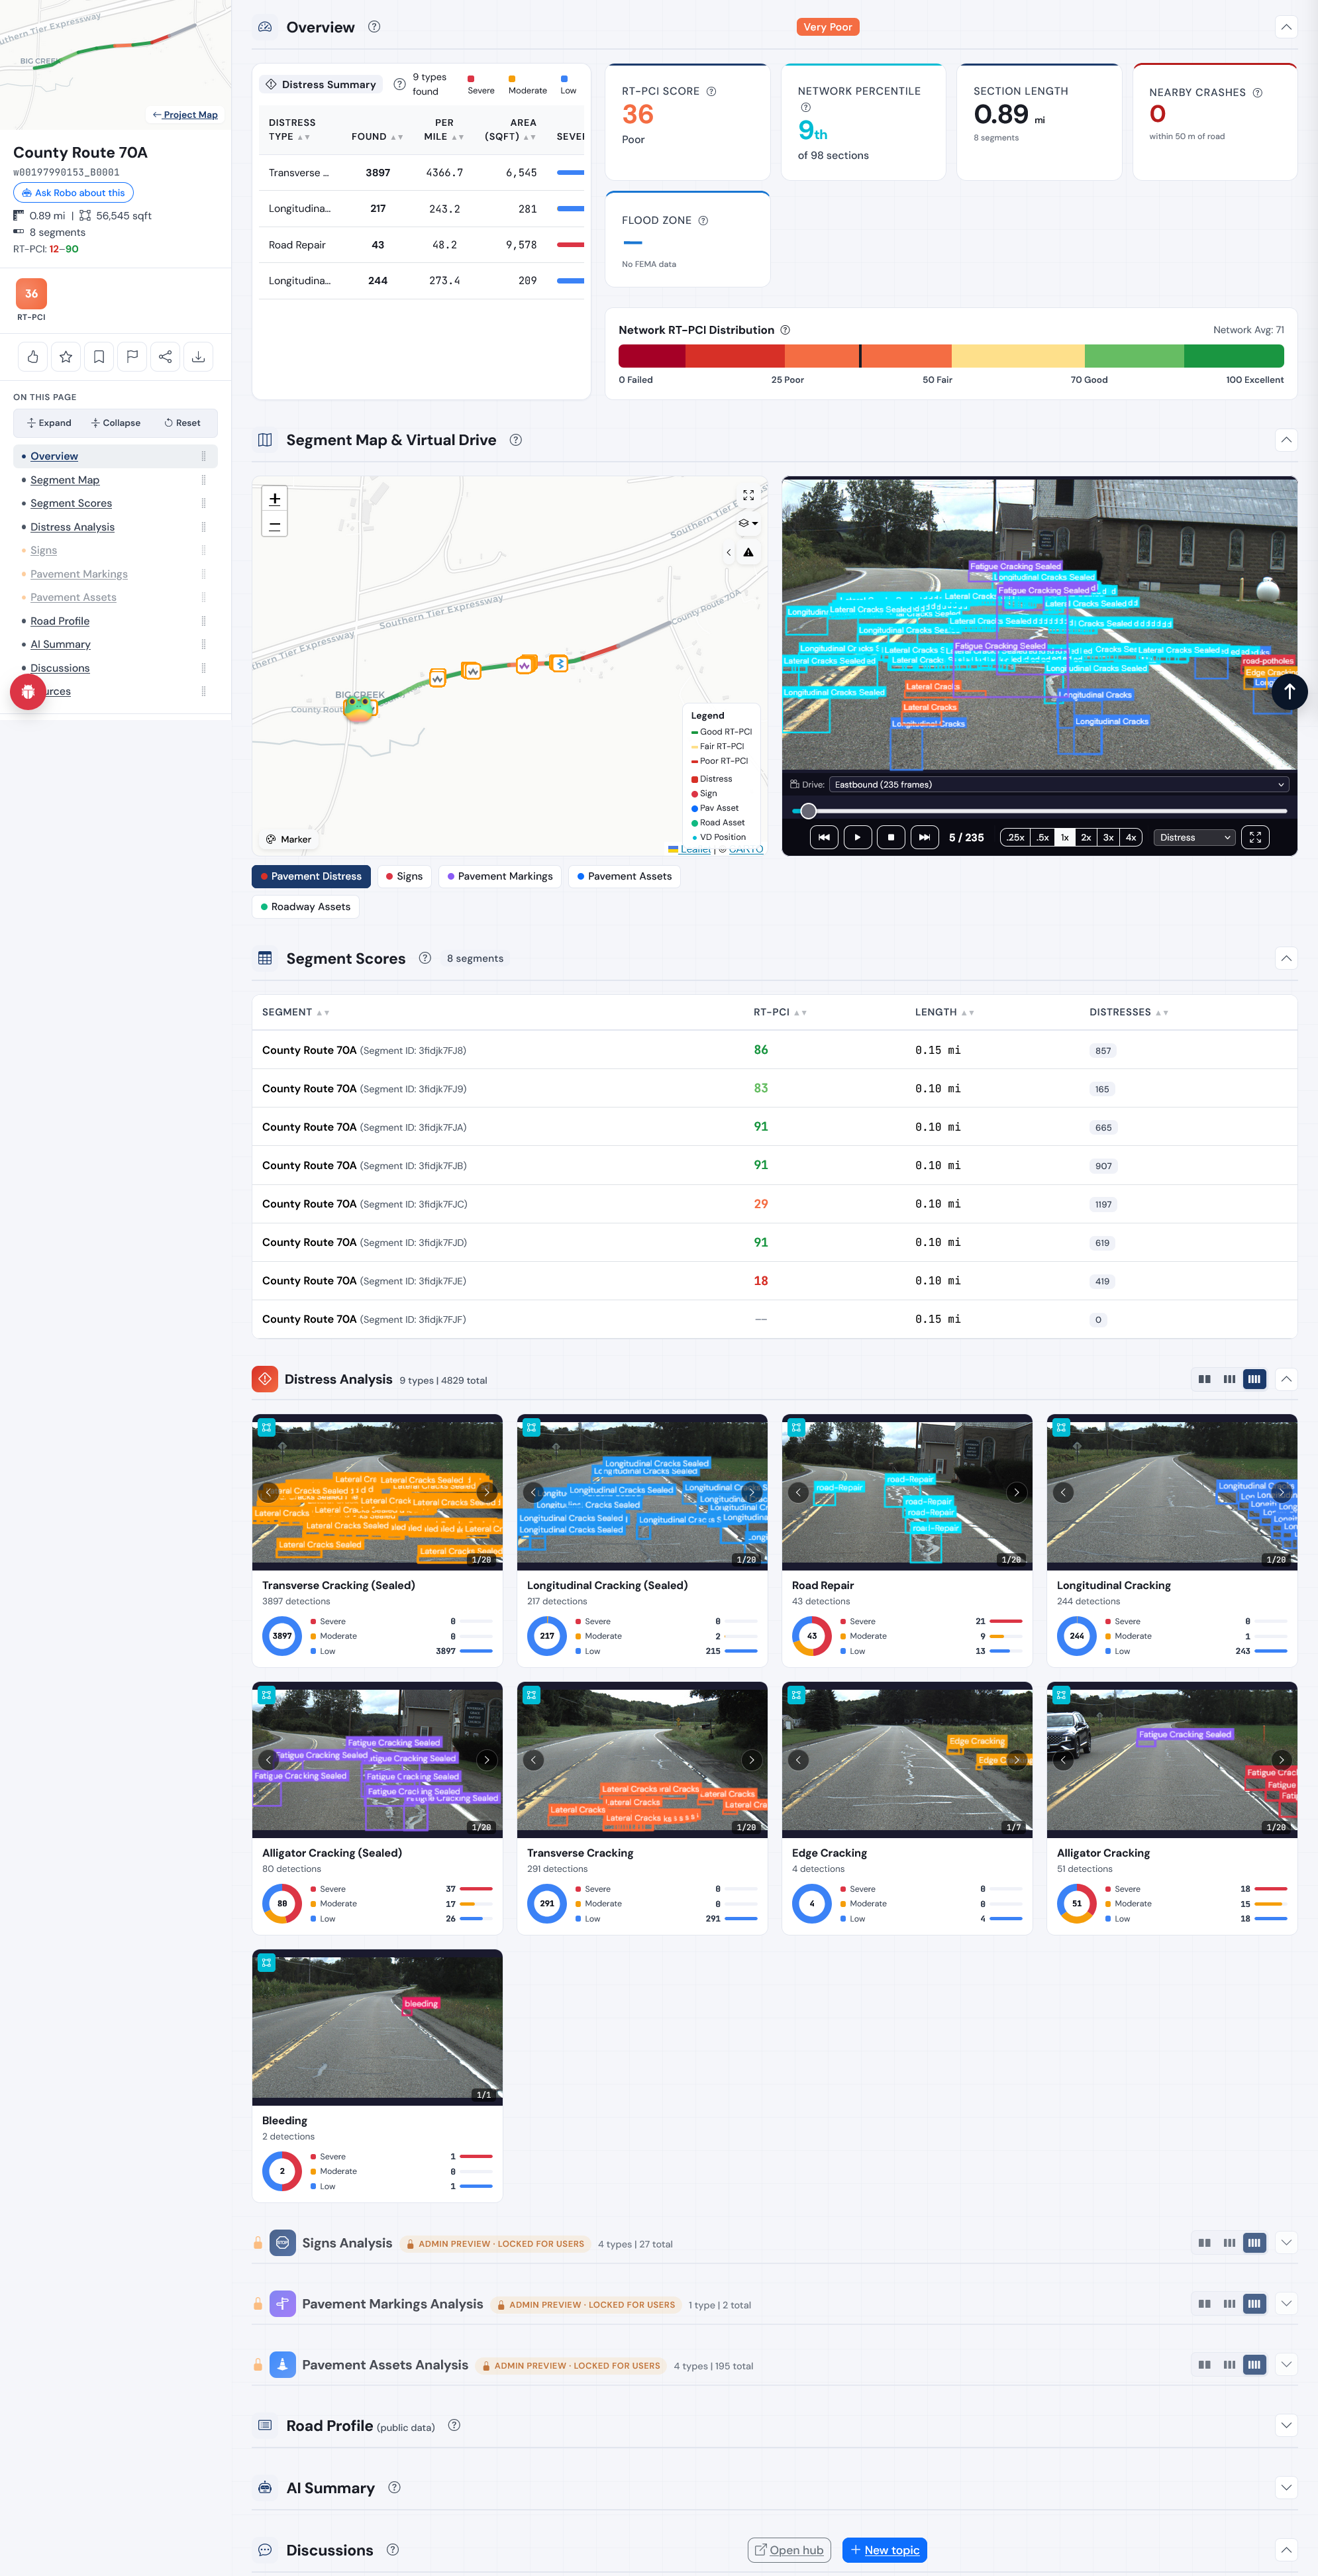
Sections are organized intersection-to-intersection and subdivided into roughly tenth-of-a-mile segments. Open one and the whole record is on a single page — overview KPIs at the top, then the segment map, the virtual drive, the score table, every annotated distress image, the AI summary, and the discussion thread, in that order.
Nothing is buried in a sub-menu. The page reads top to bottom the way a field review actually happens: get the numbers, walk the segment, check the scores, look at the photos, read what the team said.
- Overview KPIs — composite score, length, segment count, distress count
- Segment map paired with a virtual drive of the captured imagery
- Per-segment score table with per-distress-type breakdown
- Distress imagery grid with AI-annotated bounding boxes and severity
- GPS coordinates, heading, and capture timestamps on every image
- Section identifiers that match your GIS schema
Intersections aren't just where roads meet.
An intersection is its own place — multiple approach legs converge, the surface takes a different kind of beating from braking and turning, and crashes cluster there. Helm assesses intersections as their own units, with their own scores, their own distress profile, and the context of every approach feeding in.
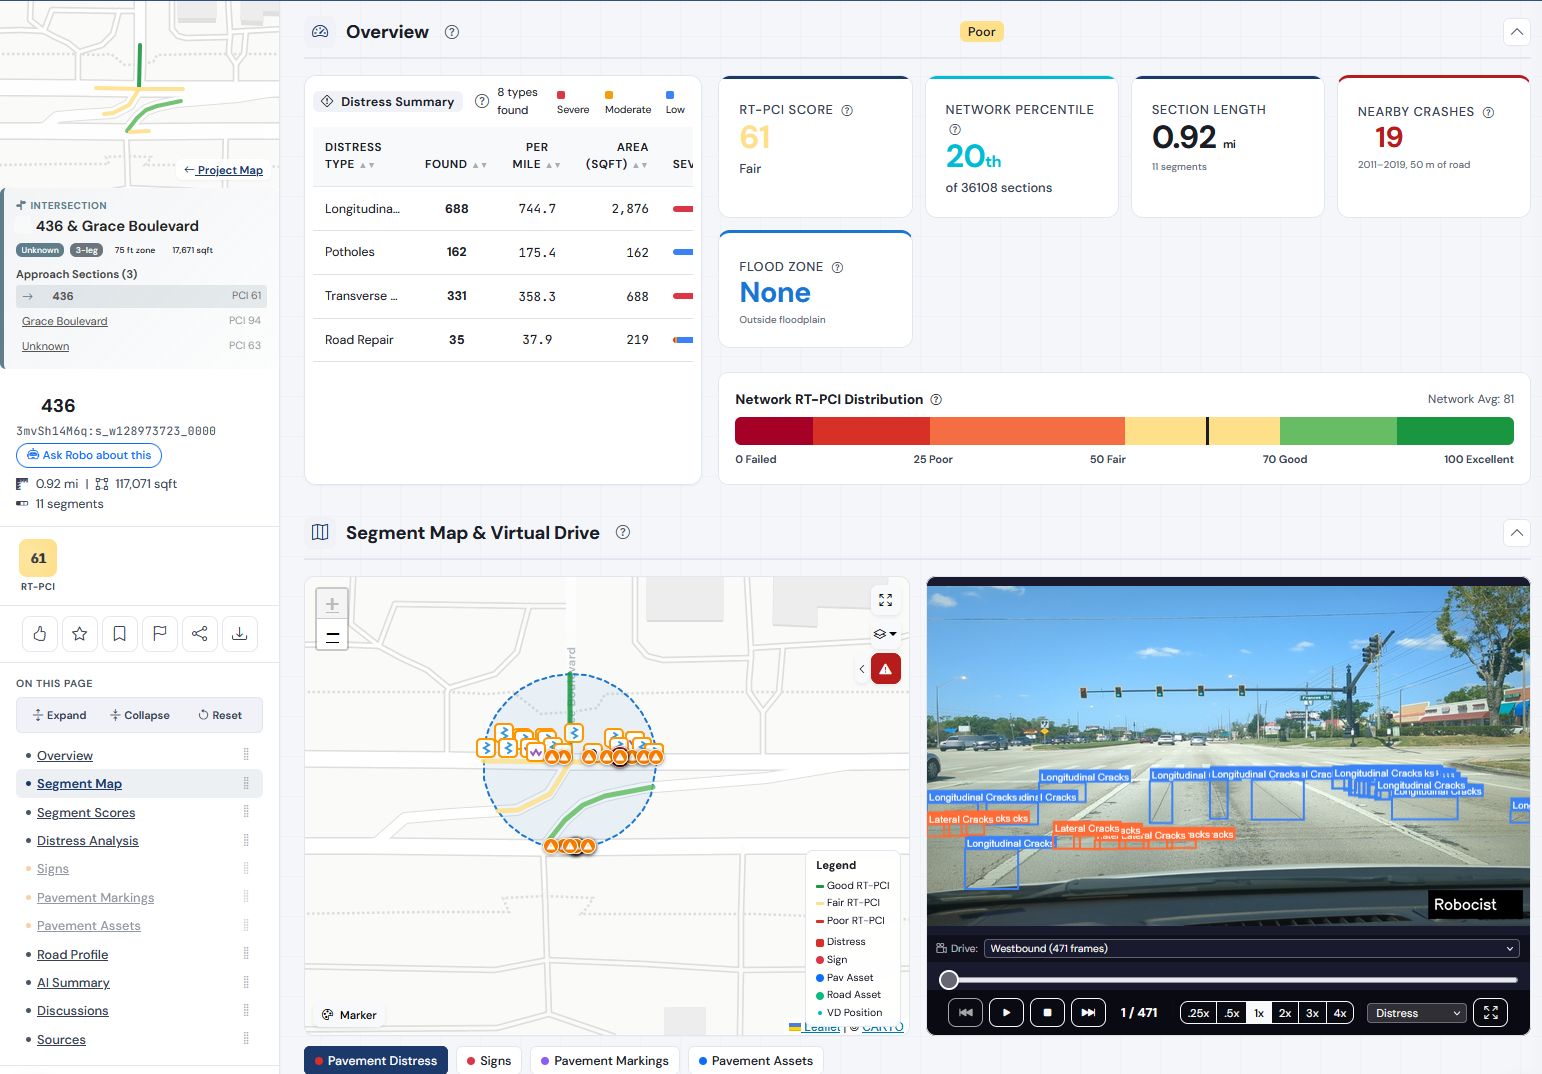
A page per intersection. Each approach scored.
Every intersection has its own detail page. The intersection's geometry, leg count, and zone size sit at the top — then each approach section is listed with its own RT-PCI, so a 94 leg and a 63 leg are never averaged into a fictional middle number.
Below that, the same kind of context an analyst would gather by hand: a distress summary scoped to the intersection footprint, network-percentile placement, length and segment count, nearby crash counts pulled from federal data, and flood-zone status — one page, no copy-and-paste.
- Per-approach scoring — intersections don't blur their legs together
- Intersection-specific distress summary and severity mix
- RT-PCI, network percentile, section length, and nearby crashes
- Flood-zone and federal overlays in context
- Segment map and virtual drive of the intersection footprint
- AI-annotated distress imagery for the intersection itself
Pick the one your team already runs.
We don't make you change your practice to use our tool. Helm scores, charts, and reports in any of the five standards below — every tile, every export, every PDF rendered in the standard you chose for the project.
Pick one per project. Helm doesn't mix standards in the same view — cross-method blending isn't engineering, it's noise.
A field dossier for the area around your project.
The Intelligence Brief is a working dossier drawn from a curated set of federal, state, and local public datasets, gathered for the area around your project. It puts crashes, climate, water, bridges, demographics, and more in one place — so the people making the call have the public-record context next to the condition data.
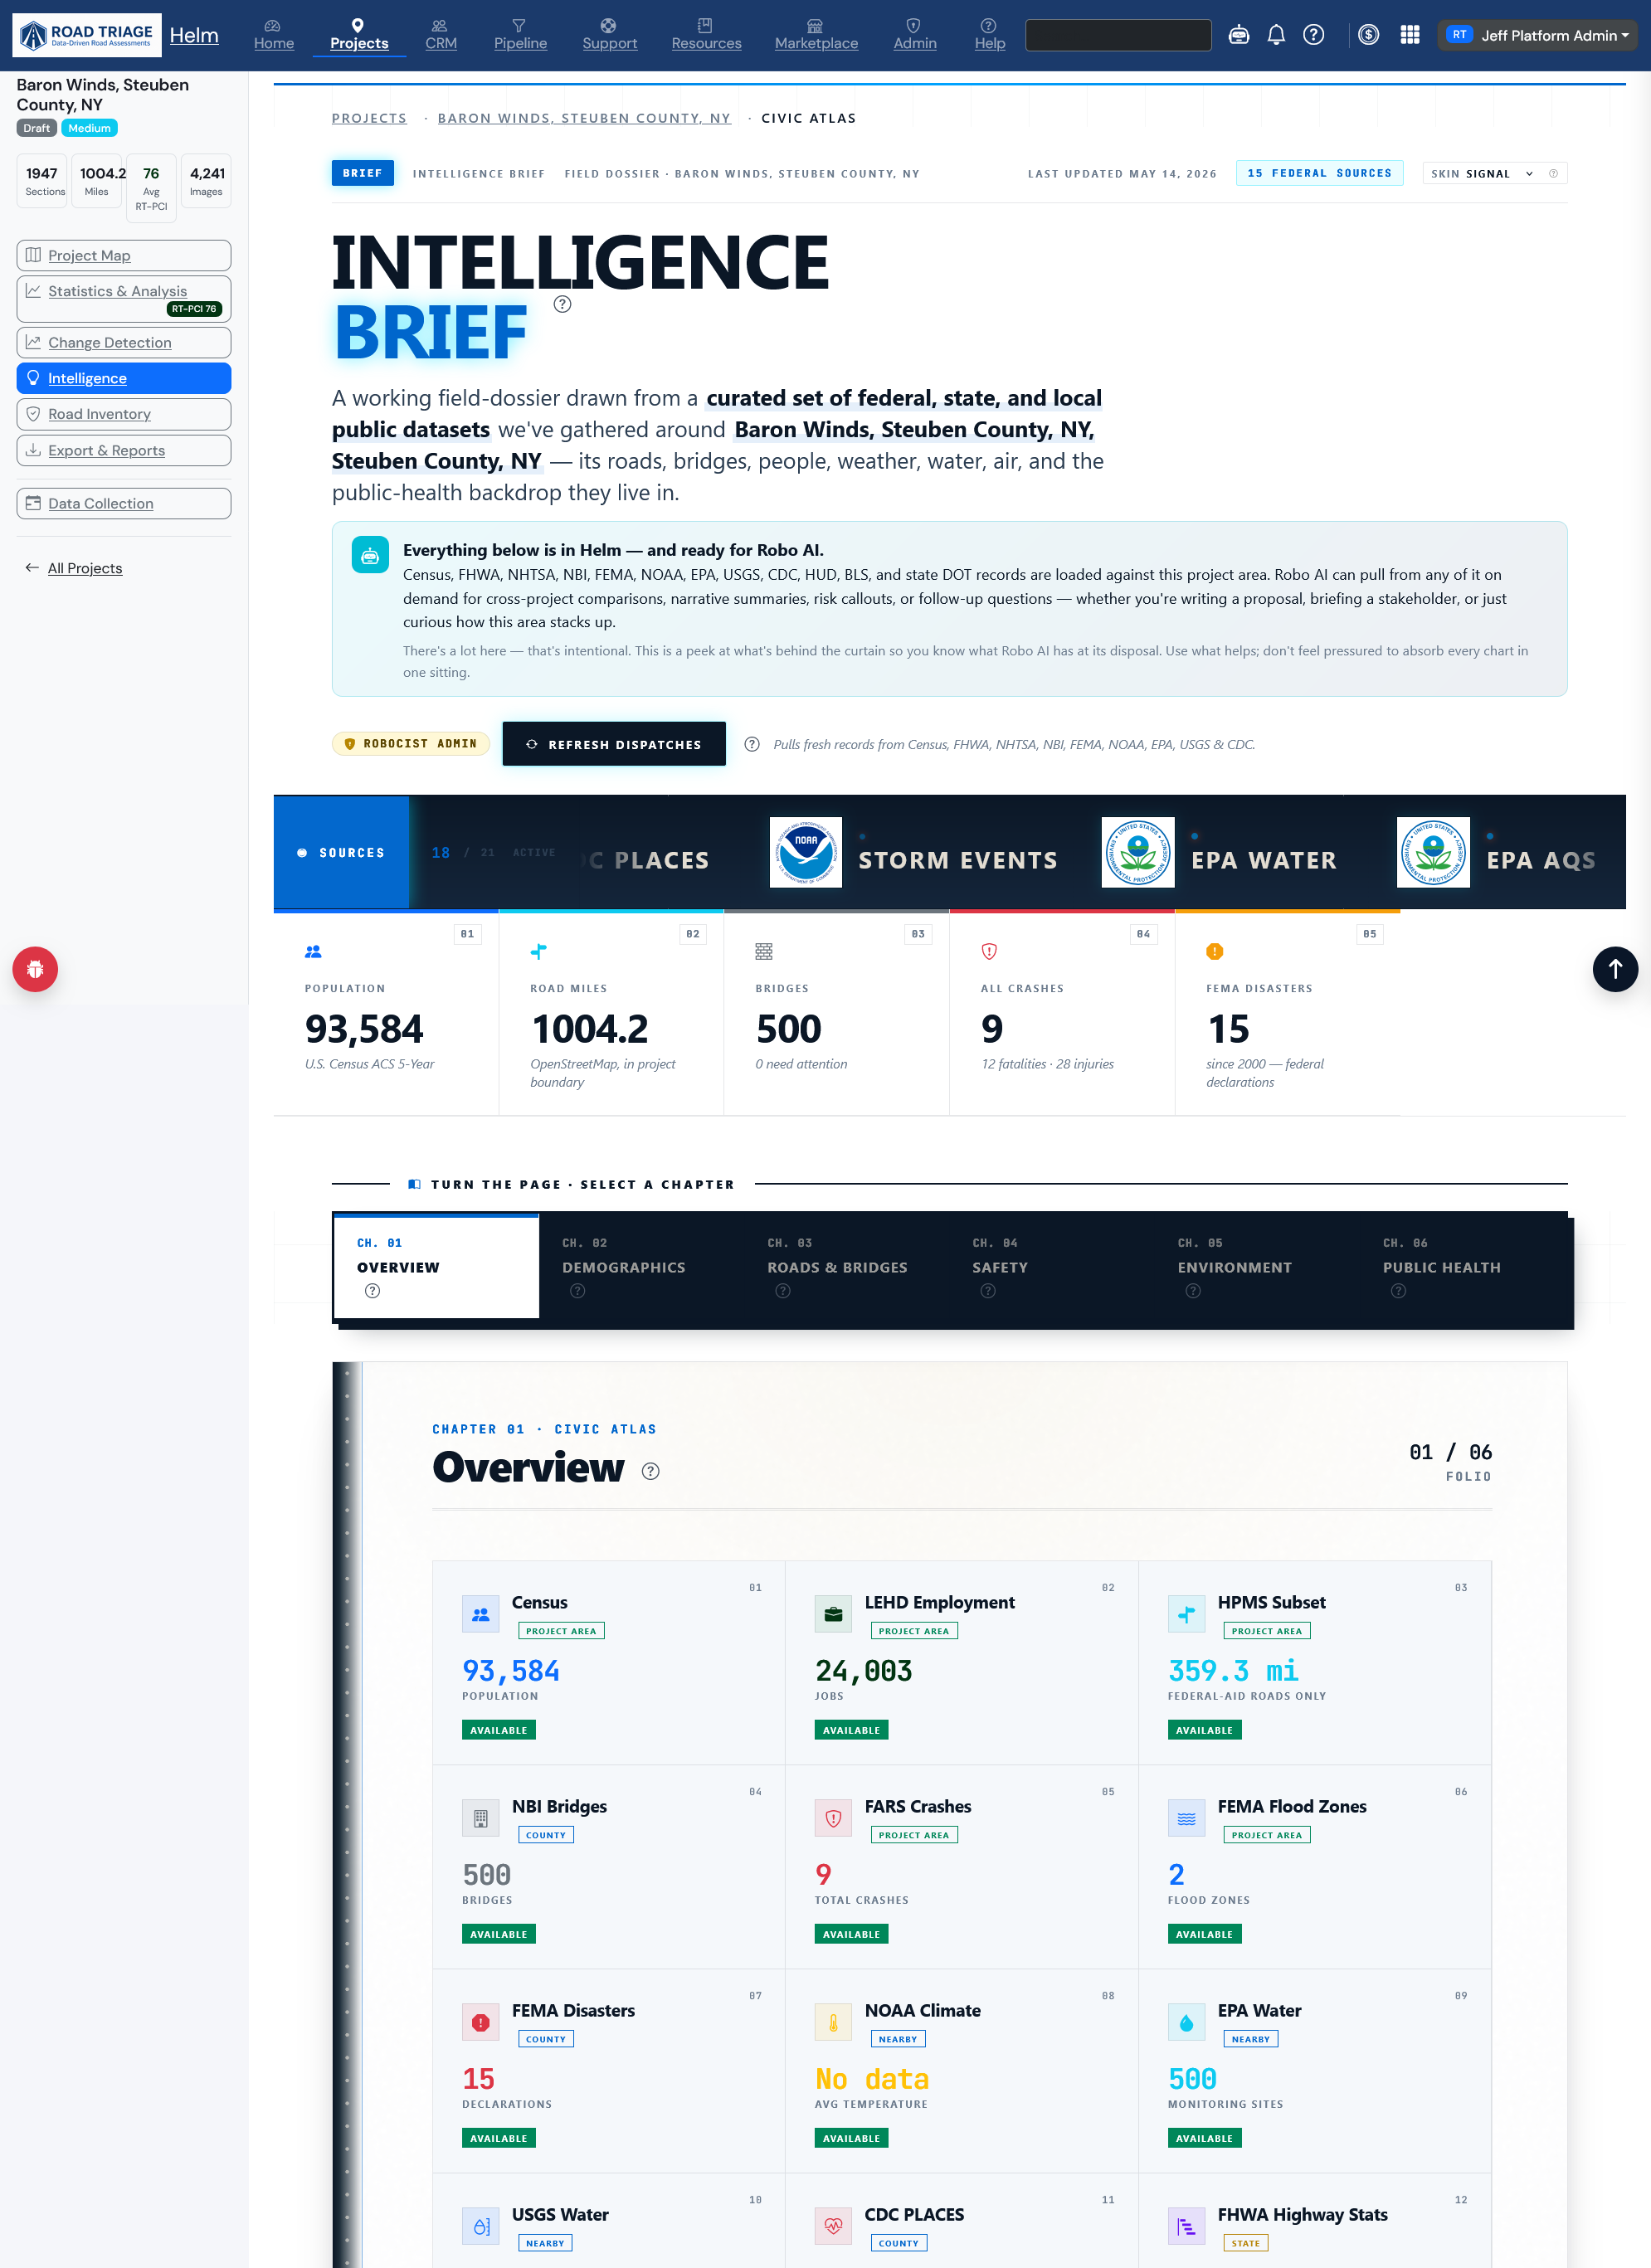
The public record, gathered and organized.
Helm pulls the relevant public datasets for your project area into a single brief: an Overview of headline figures up top, then the full record organized into chapters — demographics, roads and bridges, safety, environment, public health. Each chapter holds the source panels that belong to it, so context is one scroll away instead of scattered across a dozen agency websites.
It's a starting point for context — the picture of the place your project sits in — not a substitute for authoritative records. Critical data points should always be verified against the source of record.
- Curated federal, state, and local public datasets for the project area
- Overview KPIs plus per-source panels, organized into chapters
- Refreshable — pull the latest published data on demand
- A working dossier the whole team can read from
Ask the network a question.
Robo AI is built into Helm and wired to your project's live data. Ask plain-English questions — Robo AI answers, narrows the map, drafts reports, and shows its work, citing the underlying segments and imagery.
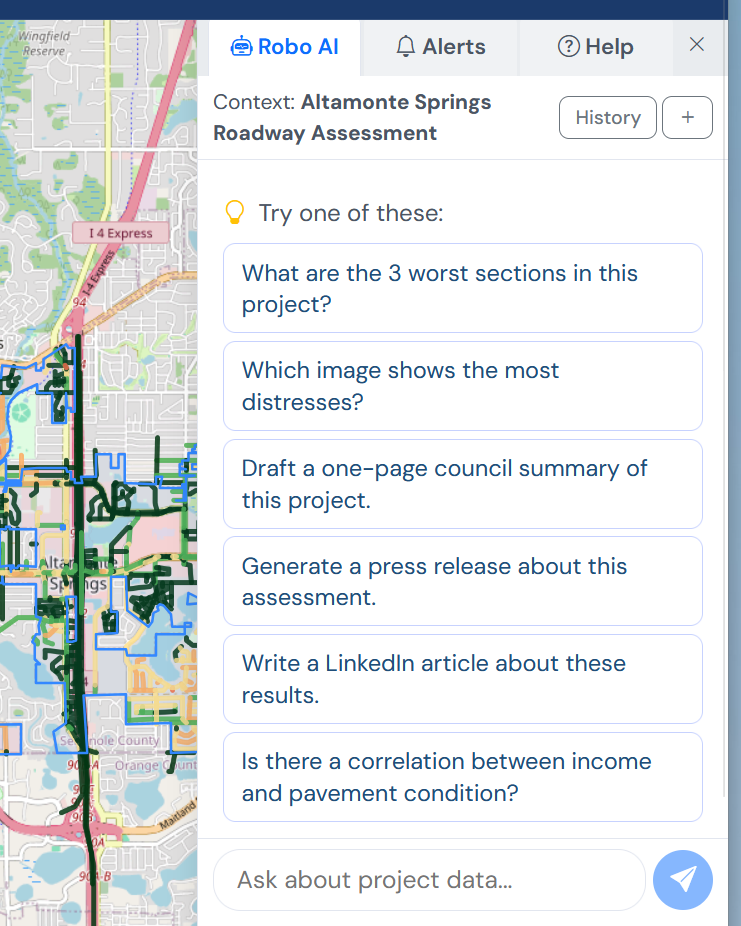
Skip the SQL. Skip the filters. Just ask.
Robo AI is wired into your project's live map and assessment data. It answers questions, narrows the view, drafts deliverables, and cites the segments and imagery behind every answer.
- Conversational queries against your assessment data
- Automatic map narrowing and layer highlighting
- One-click drafts of briefings, summaries, and section narratives
- Every answer cites its source segments and imagery
From a map view to a delivery-ready PDF, Word, or PowerPoint.
Helm's Reports module turns any filtered view into professional reports and presentations exported as PDF, Microsoft Word, and Microsoft PowerPoint files — ready for users to add their own logos and styles after export. We generate the content; the branding stays with you.
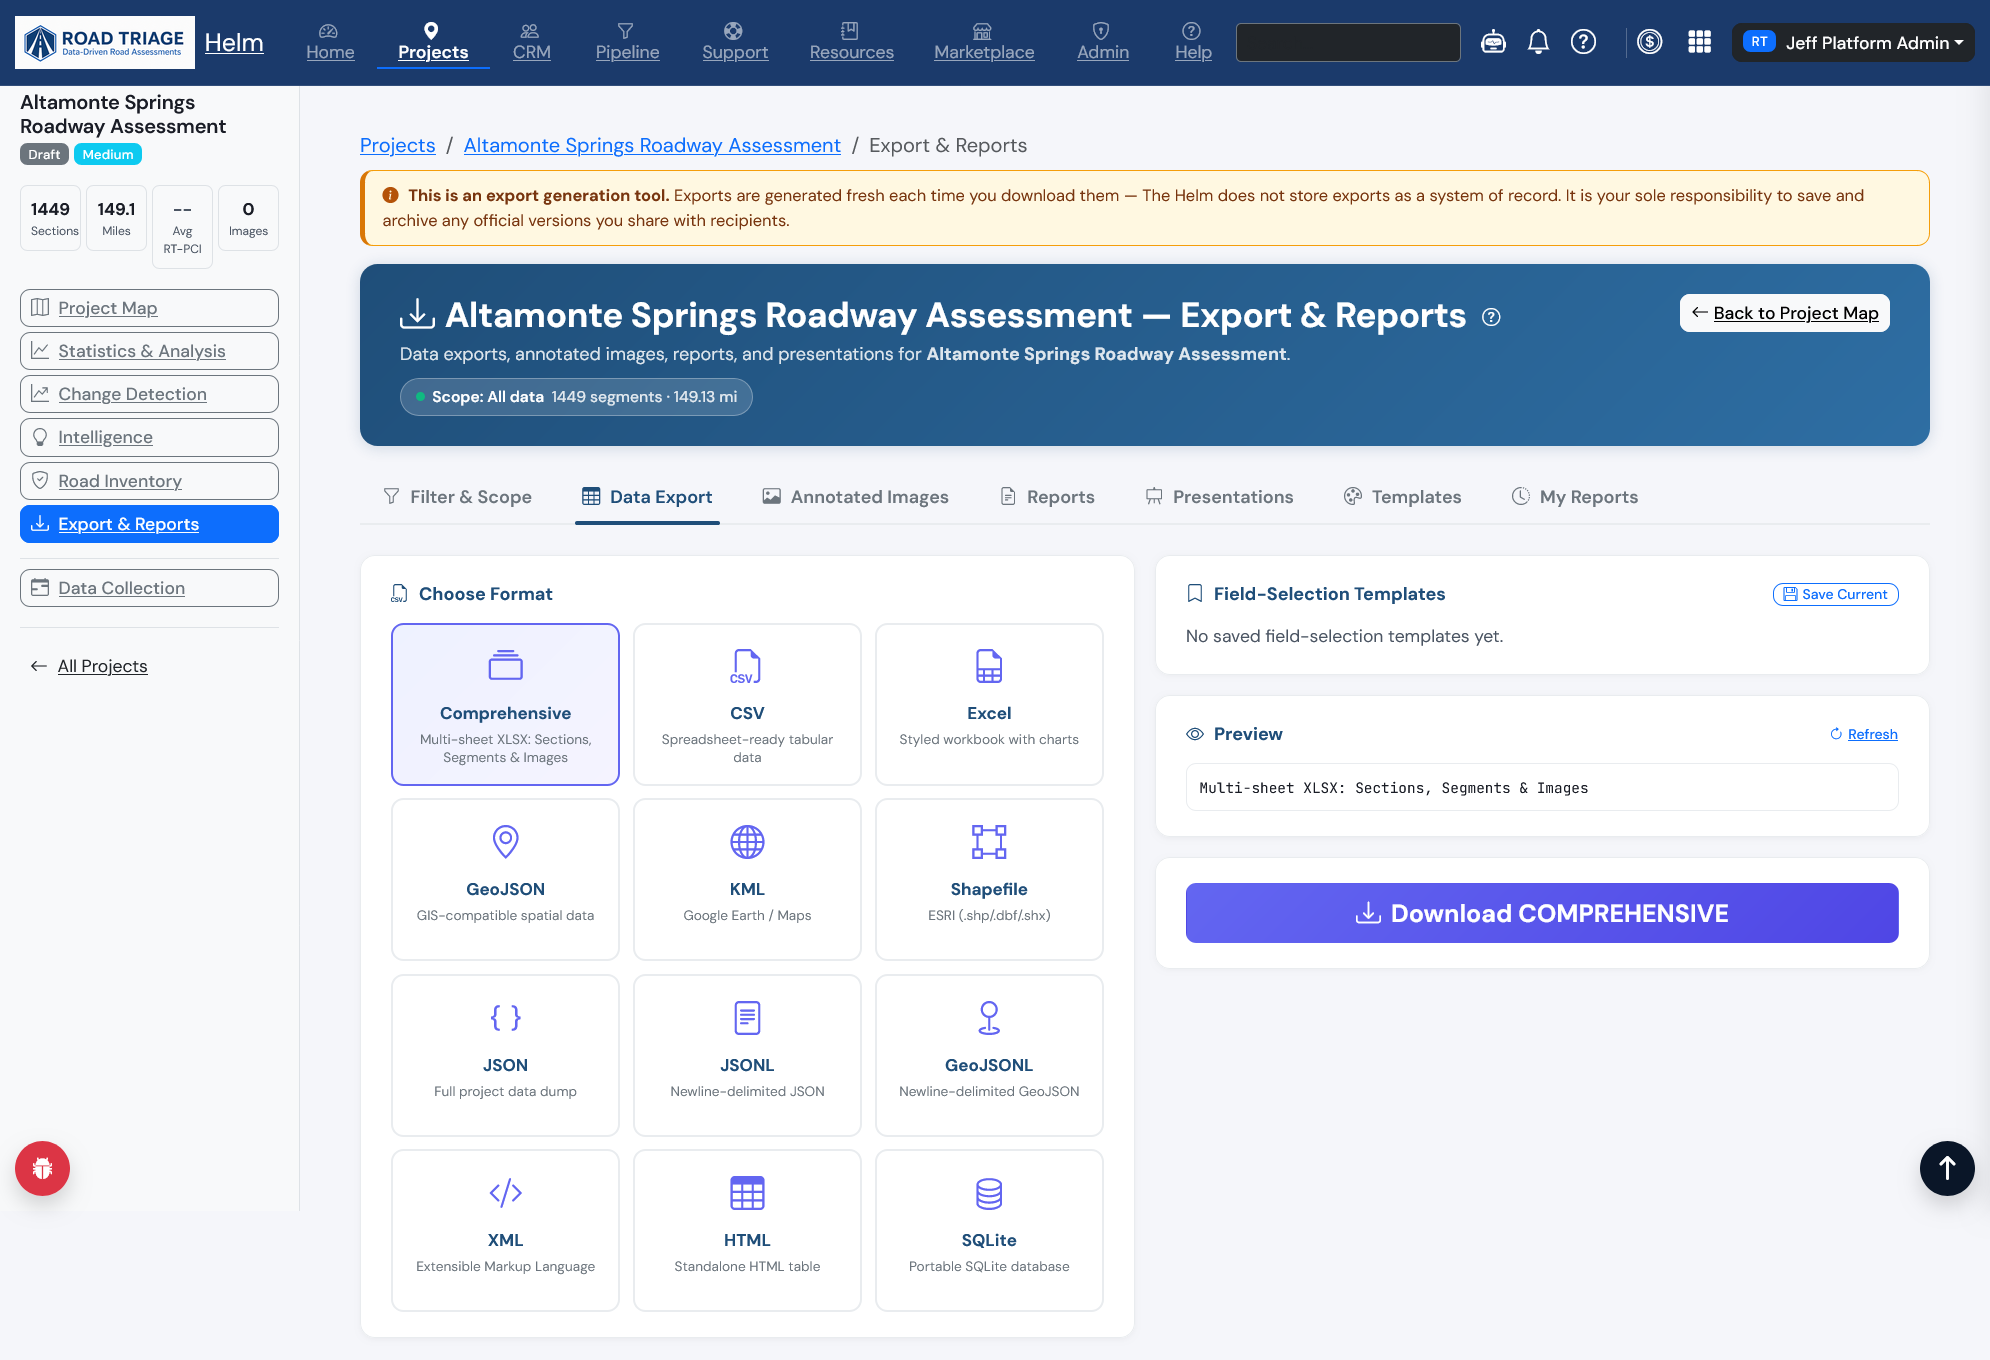
PDF, Word, and PowerPoint, on demand.
A drag-and-drop builder composes professional reports from a configurable outline of charts, tables, KPI banners, free-form text, and pre-written snippets. Section intros can be Robo-AI-drafted from your project data and then refined in place. Exports are unbranded by design — users add their own logos and styles after export.
- PDF reports with charts, tables, and KPI banners
- Microsoft Word documents for further editing
- Microsoft PowerPoint decks ready for your final polish
- Annotated survey imagery ZIPs with header strips and metadata
- Reusable templates: council briefing, public-works review, conference summary
- CSV, Excel, GeoJSON, KML, and Shapefile exports for your GIS
Permanent threads. Tied to the data.
Helm has discussions, not chat. Every thread is anchored to a specific section, intersection, or image, and stays there — searchable across cycles, with @-mentions, resolved/open status, and a permanent record next to the data it's about.
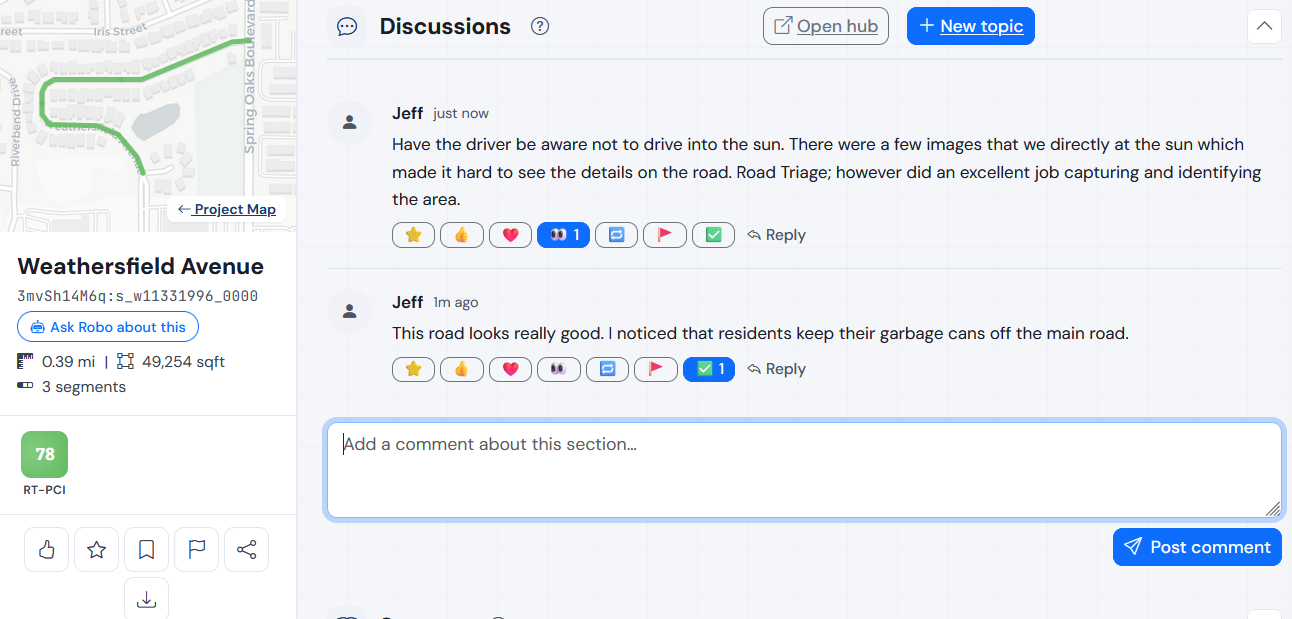
The conversation lives next to the data.
When a question about a section comes up, the answer doesn't disappear into chat history — it stays anchored to that section. Open the section a year later and the decision is right there, with the score, the imagery, and the segment map.
- Threads pinned to specific sections, intersections, or images
- Reactions, replies, and follow / favorite
- Searchable history of decisions across assessment cycles
- Discussions, not chat — not a tool that competes with Slack or Teams
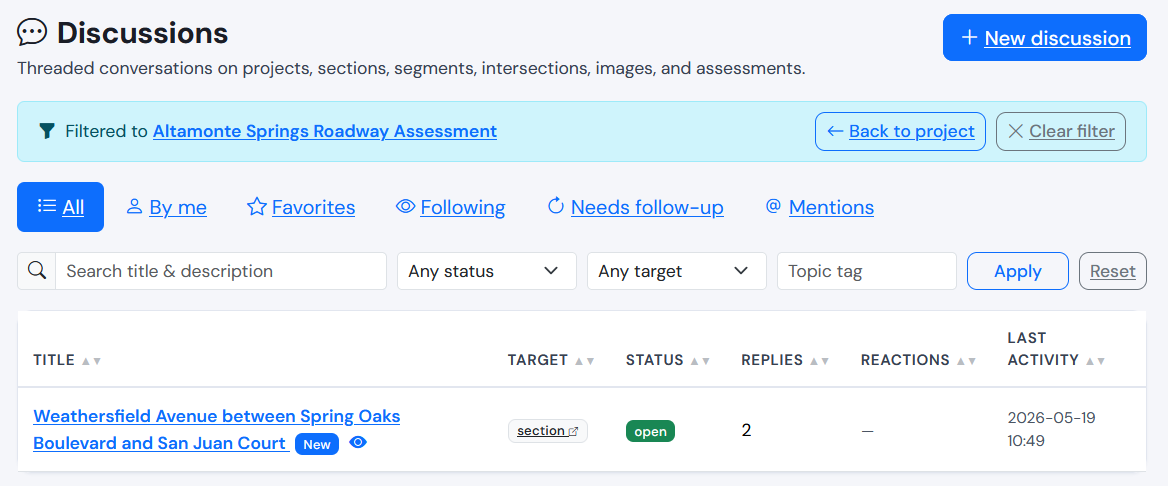
Every thread, one place.
The Discussions hub lists every thread in the project — sortable, searchable, and filterable. See what your team has flagged, what's been resolved, and what still needs follow-up.
- One project view of every thread — title, target, status, replies, reactions
- Filter chips: By me, Favorites, Following, Needs follow-up, Mentions
- Sort and search to find any past decision quickly
- Open a thread to jump back to the section it lives on
Slice the network. Compare the slices.
Draw or import a polygon — a district, a corridor, a council ward, an income-quintile shape — and Helm scopes every statistic, chart, and export to that area. Save multiple study areas per project, then compare them side-by-side for equity and capital-planning analysis.
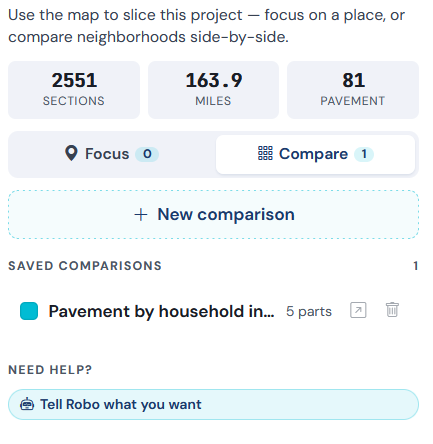
Side-by-side, slice-by-slice.
Compare the network's top income quintile against its bottom. Compare two council wards. Compare high-AADT corridors against neighborhood streets. Helm gives you the same charts and KPIs scoped to each area, side-by-side.
Sample comparison — Helm renders the same view scoped to your saved study areas.
The whole project, read at a glance.
The Statistics view rolls every segment up into network-level KPIs, score distribution, and condition charts — then ranks the best- and worst-performing sections so the priorities surface themselves.
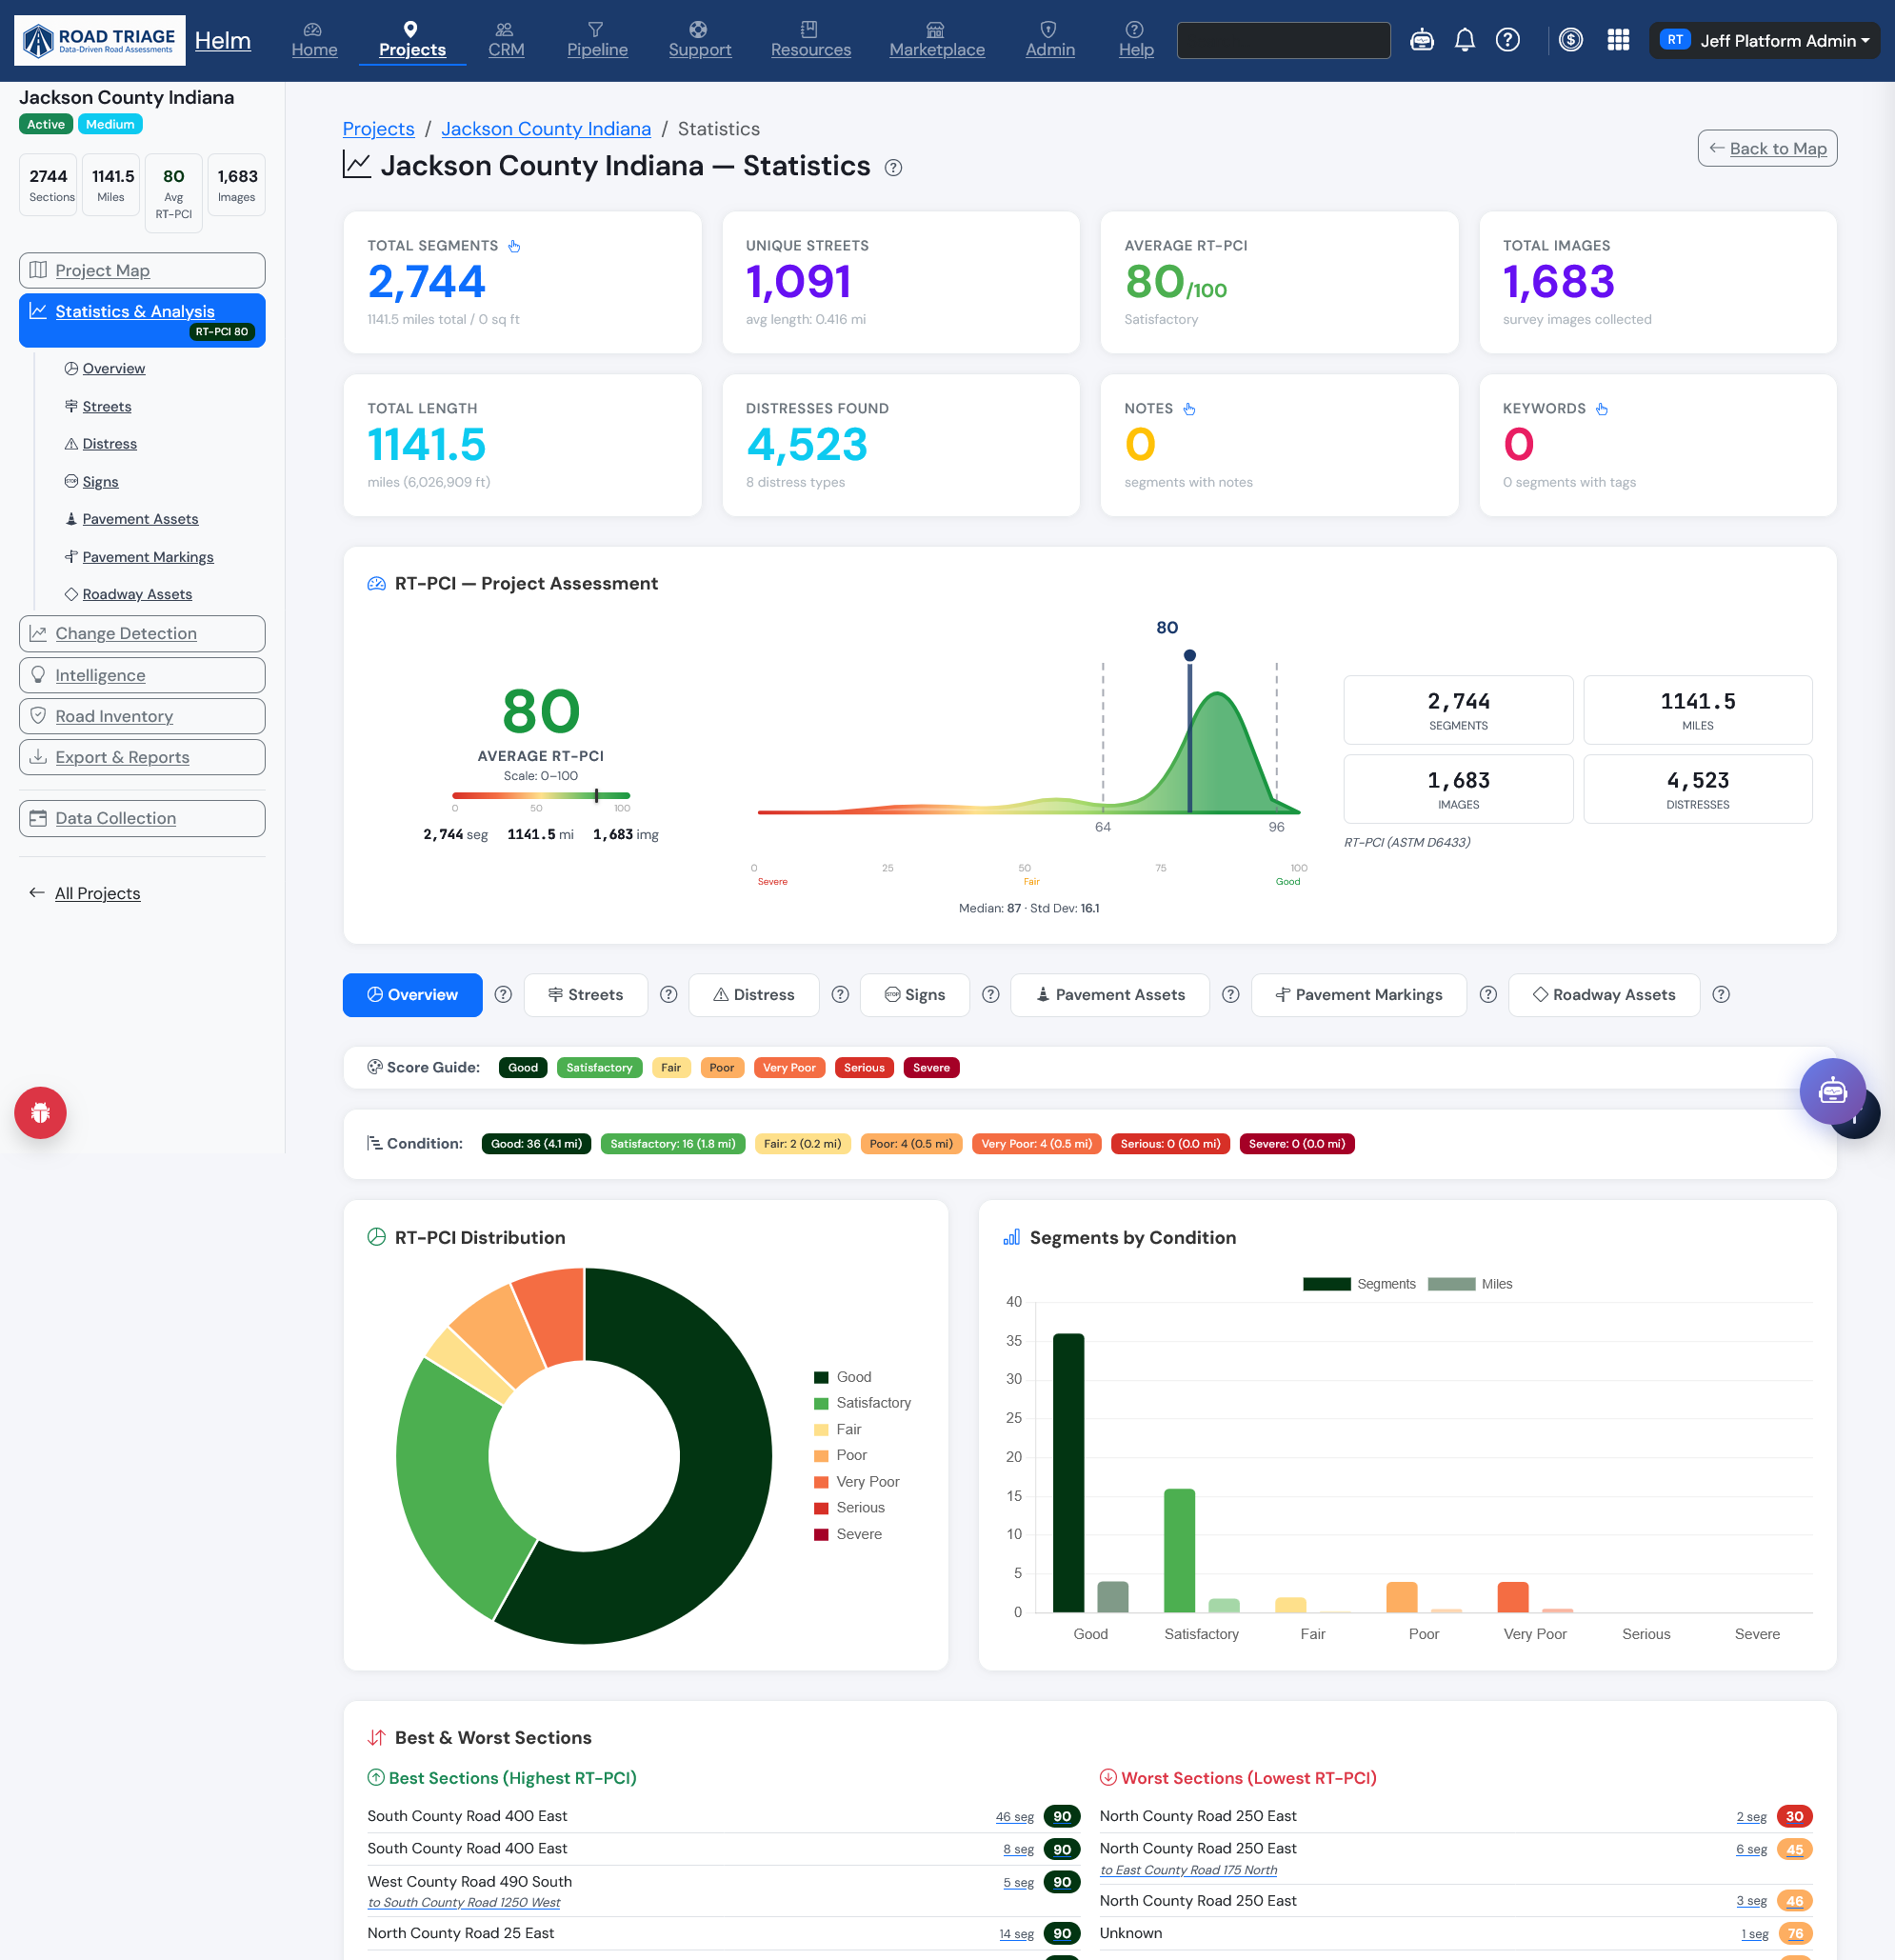
KPIs, distribution, and ranked sections.
The Statistics view rolls every segment in the project up into one page. Headline counts — segments, lane miles, total length, average score, distresses found — sit above the RT-PCI project assessment, a score-distribution donut, and a segments-by-condition breakdown.
At the bottom, Helm ranks the best- and worst-performing sections so the priorities surface themselves. Every ranked section links straight back to its place on the map.
- Network KPIs: segment counts, lane miles, total length, average score
- RT-PCI project assessment with score distribution
- Segments-by-condition breakdown across the whole network
- Ranked best- and worst-performing sections, linked to the map
- Filterable by assessment type — streets, distress, signs, markings, assets
- Rendered in the RT scoring standard you chose for the project
Standards on the inside. Your data on the outside.
Helm is built on established industry standards and treats your project data as yours — in client-isolated tables, sandboxed from every other tenant, exportable in every format your GIS or asset-management system already speaks.
Annual subscription — the platform
Your team's seat at the table. The annual platform subscription gets your agency into Helm and keeps you there for as long as it's active. Access to the Helm requires an active paid subscription.
- Create as many projects, study areas, and saved views as your team needs — assessment work is billed separately, by centerline mile, via RT Tokens
- Robo AI, Reports, Discussions
- Federal & state DOT overlays included
- Client-isolated data tables, exportable any time
RT Tokens — the assessments
Each Project Area Assessment is purchased separately with RT Tokens. Buy what you need when you need it, or prepay a pack for a discounted rate.
- One RT Token redeems one assessment for the full Project Area — not just a section
- Discounts apply for subscription length and token-pack quantity
- Pick the RT scoring standard and cycle cadence per Project Area — one combination is locked in for the area
- Within that area, mix and match the Road Triage assessment types each token covers (pavement condition, signs, markings, assets)
No vendor lock-in. No proprietary GIS schema. No data ransom. Your tables, your exports, your network — on a platform that meets the standards your engineering team already cites.
See Helm in action.
Schedule a live tour with our team. We'll walk you through a real project and show how the platform fits your agency's workflow.