Your roads are failing.
We can show you exactly where.
Road Triage combines computer vision, machine learning, and decades of pavement engineering methodology into a single automated platform. No LiDAR vans. No clipboard inspections. Just a smartphone and the truth about your roads.
Road Triage — the Transportation Intelligence Platform.
Roads are deteriorating. Budgets are shrinking. Inspections are stuck in the past.
Most municipalities still rely on manual clipboard inspections performed once every 3 to 5 years. By the time you know there is a problem, the cost to fix it has multiplied. Road Triage changes that equation entirely.
Industry estimates — actual figures vary by jurisdiction and conditions.
Reconstruction, not just detection.
We don't just label what a camera sees in one frame. We reconcile observations across many frames so the numbers you make decisions on reflect what's really on the road.
More-reliable measurements
Identified defects are confirmed across multiple frames before they affect the score. When the system isn't sure, it says so instead of guessing — which means fewer false positives and fewer surprises in the report.
Geometry the camera can prove
We don't trust raw GPS alone. We combine imagery with motion signals to figure out where the camera actually was, so defect locations line up with the real world — accurate enough for work orders, not GPS smear.
Scoring that doesn't average away problems
Image, segment, section, and intersection are each scored against the same reconciled data, not rolled up from one another. A long crack that touches several levels contributes to each correctly, so shorter sections with real problems don't get hidden inside longer averages.
Results that show their work
The math and geometry behind each score takes as much compute as the AI itself — it's not a black-box bolt-on. That depth is what lets the numbers hold up when you have to explain them to a council member or a grant reviewer.
Four Assessment Types. One Platform.
Road Triage offers four complementary assessment types, each delivering targeted data for different infrastructure management needs. Purchase the assessments your agency requires.
Pavement Condition
17 distress types detected and quantified. Five scoring methodologies: RT-PCI, RT-PASER, RT-CCI, RT-PCR, and RT-SDI.
Traffic Signs
Traffic signs classified into MUTCD-aligned categories. GPS-located, with condition assessment and change detection between cycles. Our taxonomy expands as detection accuracy is validated.
Pavement Markings
Lane lines, centerlines, crosswalks, arrows, and specialty markings inventoried and rated for presence and visible condition. MUTCD retroreflectivity thresholds are out of scope.
Roadway Assets
Signals, drainage, utilities, hydrants, guardrails, and other right-of-way assets. Continuously updated infrastructure inventory.
Two collection methods.
One platform.
Road Triage supports two data collection approaches — each purpose-built for different assessment needs, both powered by the same AI platform.
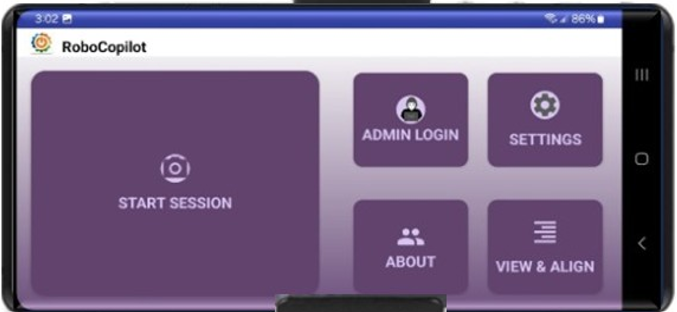
Smartphone Collection
A pre-configured smartphone mounted in any fleet vehicle. Your staff presses Start and drives their normal routes. Our AI handles pavement condition, sign inventory, markings, and asset detection.
- Locked kiosk mode — no training required
- Mounts in any passenger car or light-duty truck
- Uploads automatically via Wi-Fi overnight
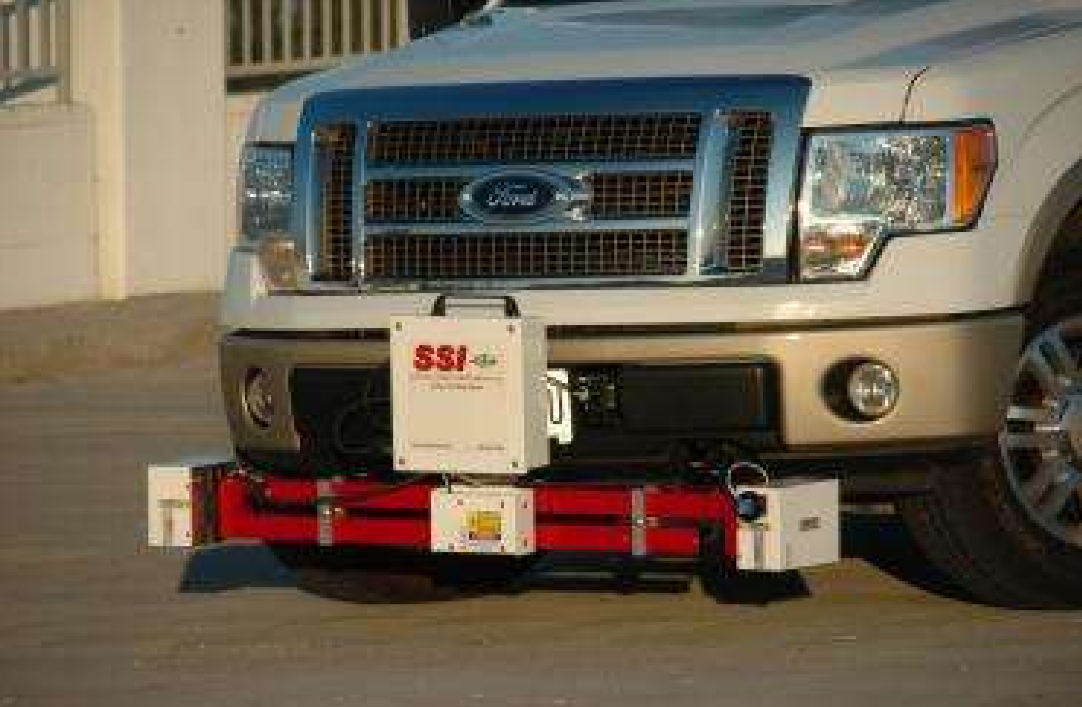
SSI Inertial Profiler
For agencies that require certified ride-quality, rutting, and faulting metrics, Road Triage integrates with Surface Systems & Instruments inertial profiling hardware to capture high-precision surface data alongside our AI assessments.
- Ride-quality, rutting, faulting, and macro-texture measurement
- Operates as a standalone datalogger — no separate device required
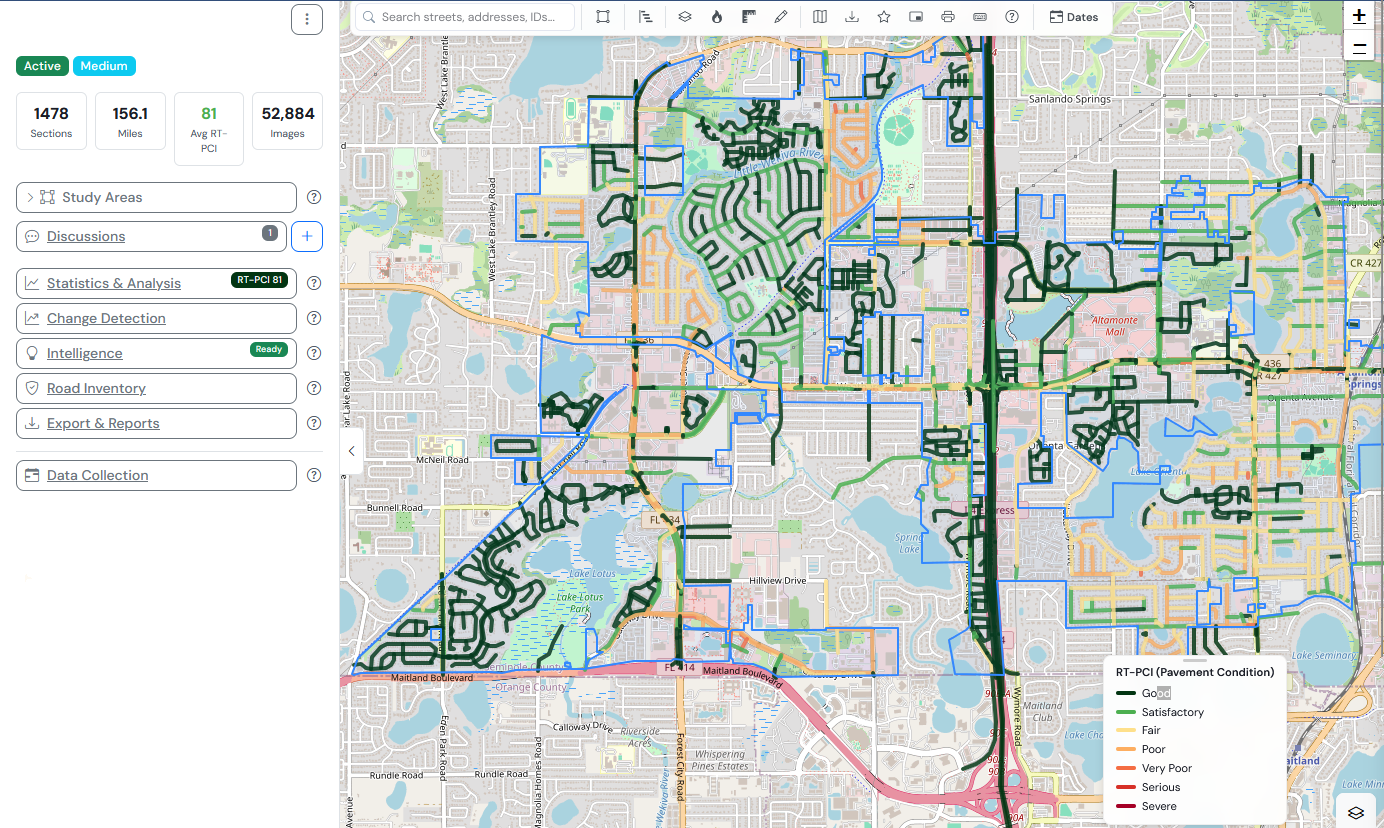
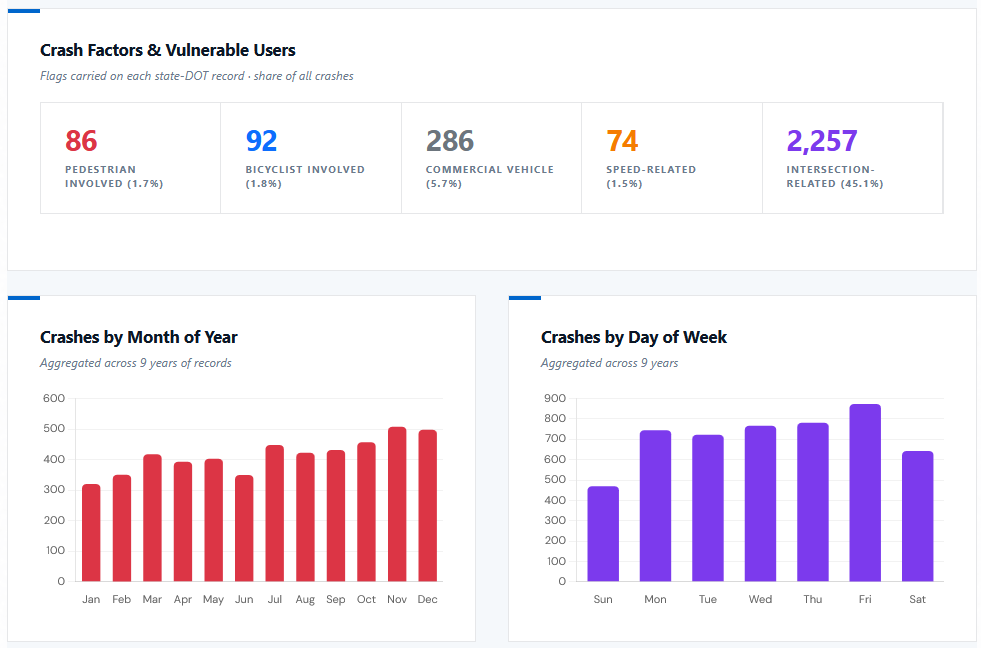
See what your data looks like.
Interactive maps, analytics dashboards, crash heatmaps, and infrastructure overlays — your assessment results, visualized and actionable.
Proven in the field.
By using this groundbreaking system, we are not just responding to resident concerns, we are anticipating them. Robocist's technology helps us work smarter, protect taxpayer dollars and preserve the high standards our community expects.
Road Triage technology was originally developed and validated with the North Carolina Department of Transportation. SSI (Surface Systems & Instruments) evaluated competing AI solutions and selected Road Triage for integration into their global platform of 1,200+ systems across 26 countries.
Ready to see your roads clearly?
Schedule a demonstration and discover how Road Triage can modernize your road assessment program.